The surprising relationship between property prices and interest rates

Now that the Reserve Bank has started raising official interest rates, you might be wondering: does that mean property prices will fall?
The short answer is that prices might decline in some places in 2022, such as New South Wales and Victoria. However, prices are likely to rise in others, such as Queensland and South Australia. So there’s no direct correlation between rates rising and prices falling. Before we explain why in detail, let’s provide some recent history. From late 2020 to early 2022, Australia experienced one of the biggest property booms in its history. No boom can last forever – and, indeed, as the graph below shows, the national median price had already been cooling well before the Reserve Bank raised the cash rate in May 2022.

Different markets experience different cycles, which is why, as the graph shows, prices in Melbourne and Adelaide have performed differently to the national result. That said, if we focus just on the overall national numbers, we can see:
- The first monthly price increase in this cycle occurred in October 2020, when the national median property price rose 0.4%, according to CoreLogic
- Price growth peaked in March 2021, at 2.8%
- Since then, national growth has been trending down, falling to 0.6% in April 2022, just before the Reserve Bank started increasing the cash rate (although different markets have outperformed the national average)
So even if the Reserve Bank had left the cash rate on hold, prices might’ve started declining at some point this year – not because of any flaw in the Australian property market, but because history suggests prices take two steps forward and then one step back. In other words, long-term price growth never occurs in a straight line.
History shows there’s often no direct connection between rates and prices
If you take a deep dive into the data, and compare the cash rate with property prices, you’ll see there’s no direct link between the two. That is, prices don’t automatically increase when rates decrease, nor do they automatically fall when rates rise. In fact, they often move in tandem.
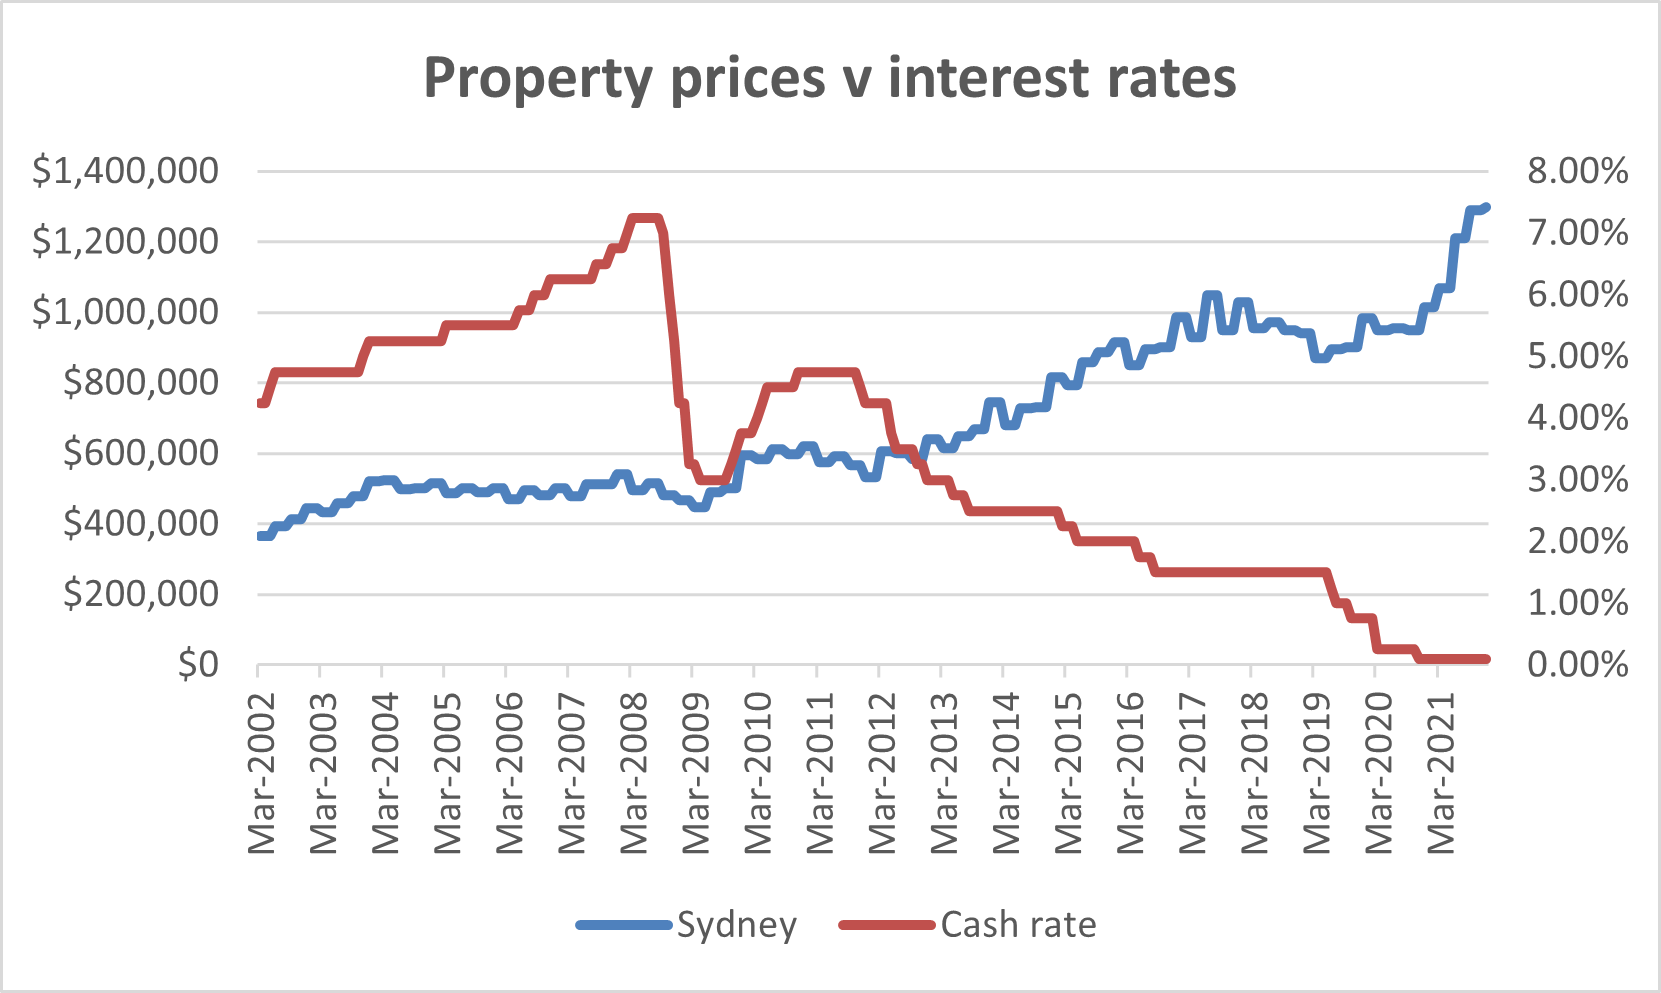
To prove the point, we’ll focus on the period between the quarters of March 2002 (when the Australian Bureau of Statistics began publishing median property prices) and December 2021 (the most recent quarter for which there’s data). To keep things simple, we’ll look at just one market – Sydney. And we’ll compare Sydney prices with the cash rate.

Between March 2002 and March 2008, the Reserve Bank increased the cash rate from 4.25% to 7.25%. During that time, Sydney’s median property price rose from $365,000 to $495,000. So interest rates and property prices moved in the same direction.
Between March 2008 and March 2009, the cash rate fell from 7.25% to 3.25%, while Sydney prices fell from $495,000 to $448,000. So rates and prices moved in the same direction.
From March 2009 to December 2010, the cash rate initially fell from 3.25% to 3.00% but then steadily climbed to 4.75%. During that time, prices rose from $448,000 to $620,000. So rates and prices moved in the same direction.
From December 2010 to December 2011, the cash rate fell from 4.75% to 4.25%, while Sydney prices fell from $620,000 to $567,000. So rates and prices moved in the same direction.
From December 2011 to December 2013, the cash rate fell from 4.25% to 2.50%, while prices rose from $533,000 to $745,000. So, this time, rates and prices moved in opposite directions.
From December 2013 to September 2014, the cash rate remained on hold at 2.50%, while Sydney prices fell from $745,000 to $730,000. So rates and prices moved in opposite directions.
From September 2014 to December 2015, the cash rate fell from 2.50% to 2.00%, while prices jumped from $730,000 to $915,000. So rates and prices moved in opposite directions.
From December 2015 to September 2016, the cash rate fell from 2.00% to 1.50%, while prices fell from $915,000 to $900,000. So rates and prices moved in the same direction.
From September 2016 to December 2017, the cash rate remained on hold at 1.50%, while prices rose from $900,000 to $1.029 million. So rates and prices moved in opposite directions.
From December 2017 to March 2019, the cash rate remained on hold at 1.50%, while prices fell from $1.029 million to $870,000. So rates and prices moved in opposite directions.
From March 2019 to December 2020, the cash rate fell from 1.50% to 0.10%, while prices rose from $870,000 to $1.015 million. So rates and prices moved in opposite directions.
From December 2020 to December 2021, the cash rate remained on hold at 0.10%, while prices rose from $1.015 million to $1.300 million. So rates and prices moved in opposite directions.
Interest rates are just one factor that influences property prices
So it’s not true that interest rates directly influence property prices. But nor is it true that interest rates have no influence on property prices. Rather, interest rates are just one factor that influences demand. Others include:
- Banks’ lending policies
- Wages growth
- The unemployment rate
- Population growth
- Consumer confidence
Also, don’t forget that the property market, like all markets, is influenced by both demand and supply. In this context, supply means:
- How many new homes are being built
- How many properties are being listed for sale
In other words, numerous factors influence whether property prices go up or down. Interest rates are one factor, but there are many others too.
If you’re interested in building long-term wealth, Auswide Buyer’s Agency can help. To discuss your options, book a free consultation with Ashish Malhotra.

