Different markets grow at different speeds

You can learn a lot about property investing from reading the newspaper and listening to podcasts. But you can also be easily misled. That’s because the media often talks about ‘the property market’ – i.e. the ‘Australian property market’. The only thing is, there’s no such thing as the Australian property market. Why? Because conditions vary significantly from city to city, and even state to state.
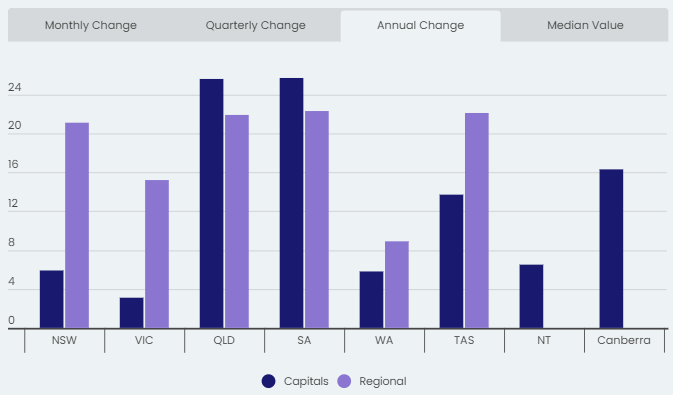
To illustrate the point, look at the most recent CoreLogic price statistics. Over the year to June, Australia’s median property price rose 11.2%. But price growth varied significantly from city to city:
- Adelaide = 25.7%
- Brisbane = 25.6%
- Canberra = 16.3%
- Hobart = 13.7%
- Darwin = 6.5%
- Sydney = 5.9%
- Perth = 5.8%
- Melbourne = 3.1%

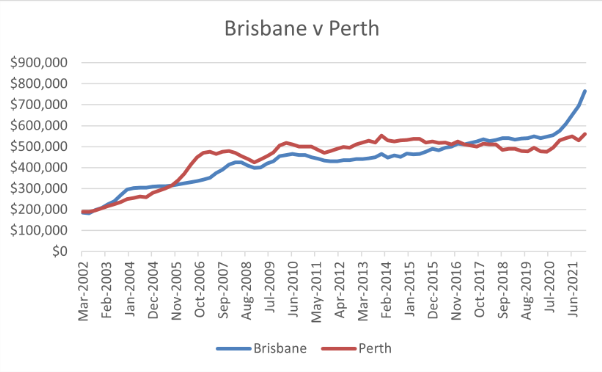
This difference between markets becomes even clearer if we zoom out over a longer timeframe. Let’s compare Brisbane and Perth, from 2002-21, based on data from the Australian Bureau of Statistics.

In March 2002, their median house prices were very similar – $185,000 for Brisbane and $190,000 for Perth. By September 2005, they were practically equal, with Brisbane growing 70.2% to $314,900 and Perth 65.8% to $315,000.
From that point on, though, their paths diverged.
By June 2010, their median prices were $465,000 for Brisbane (after increasing another 47.7%) and $510,000 for Perth (up 61.9%).
In December 2013, Brisbane was still on $465,000 (0% growth), while Perth had climbed further to $552,000 (8.2% growth).
Then the script flipped: by June 2020, Brisbane had advanced to $547,000 (up 17.6%), while Perth had retreated to $475,000 (down 13.9%).
From there, both cities grew, but Brisbane’s growth rate was much higher than Perth’s. By December 2021, their median prices were $765,000 for Brisbane (up 39.9%) and $560,000 for Perth (up 17.9%).
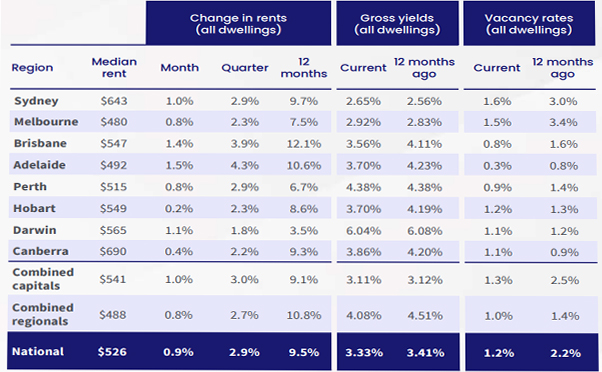
CoreLogic’s most recent rental statistics tell a similar story. Over the year to June, the median weekly rent jumped by a remarkable 9.5%. However, each city performed very differently, with rents surging 12.1% in Brisbane but growing only 3.5% in Darwin.

Different states, different economies
You might be wondering – why do prices and rents move at different speeds in different parts of Australia? After all, Australia is one country, so shouldn’t all its property markets move in harmony?
Well, when you drill down into the data, you might be surprised to discover just how much economic divergence there is between states. For example, while the national unemployment rate in June was just 3.5%, according to the most recent data from the Australian Bureau of Statistics, there was considerable geographical divergence:
● Victoria = 3.2%
● New South Wales = 3.3%
● Western Australia = 3.4%
● Northern Territory = 3.7%
● Queensland = 4.0%
● Tasmania = 4.3%
● South Australia = 4.3%
Economic conditions vary greatly from state to state. Western Australia is booming at the moment, because demand for its commodities has gone through the roof. But South Australia’s economy is not performing as strongly, because it’s more dependent on manufacturing, a sector that isn’t doing as well.
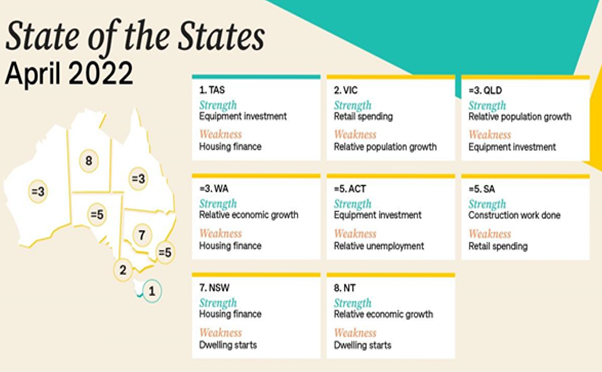
CommSec’s quarterly State of the State report does a good job of capturing the state-by-state variation, as you can see from the most recent report, in April.

Why investors should embrace diversification
Property investors should draw two important lessons from all this data.
First, as CoreLogic’s price and rental statistics show, not all investment locations are created equal. So you need to do a lot of research before choosing an investment location.
Second, it’s important to diversify. All things being equal, it makes sense for your second investment property to be in a different location to your first.
If we look at median house prices for June 2012 (from the Real Estate Institute of Australia) and June 2022 (from CoreLogic), we can see Sydney and Brisbane enjoyed very similar levels of growth in their median house price over those 10 years – 115% v 106%. But their markets have often moved in very different rhythms. For example, over the past quarter, house prices have fallen in Sydney (by 3.0%) yet increased in Brisbane (by 2.5%).
So an investor who had, say, one property in each city would probably have had a smoother ride over that decade than an investor who had two properties in the same city.
Diversification protects you from volatility and risk.
Auswide Buyer’s Agency can help you build a diversified investment property portfolio. To discuss your options, book a free consultation with Ashish Malhotra.

